Business Analytics is a hybrid discipline combining advanced mathematics, applied statistics, and enterprise computer science with basic business common sense. A business analytics expert enables you, a business leader, to understand, quantify, and improve your business inputs, operations, and outputs to minimize losses and maximize quality and thereby achieve your corporate mission of serving others. This blog focuses on first-person business analytics scenarios for both small and large businesses as well as third-person analysis of the economy as a whole.
Higher education has a greed problem. Like Dr. Suess's Yertle the Turtle, adjunct professors, secretaries, and other critical players are bearing the burden of education, while being paid less and less, both in terms of a diminishing portion of tuition and fees, and in terms of inflation. Yet, at the same time, savvy businesses and individuals suck in vast sums of governmental educational aid and skyrocketing tuition and fees.
Just how bad is it?
Forty-two years ago, Mountain View Community College's pay rate for a brand new first-time adjunct instructor over the summer of 1976 was $1,500 for a three-credit-hour course (source: personal interview of teacher). During this same summer, on page 18, we can see that the tuition for the three-credit hour courses in question, per student, was $30 with no fees, or $10 total per credit hour.
Today, an unnamed private 4-year university with graduate school, as of fall 2018, charges over $2,700 for the equivalent three-credit hour course, plus over $150 of fees, while paying the teachers the same amount of $1,500 per three-credit-hour course. Both the tuition and pay rate are mid-range for the institution's peer group (source: regional governing body and human resources)
Students are being charged over 95 times as much while teachers are being paid the same. In fact, adjusted for inflation, which has risen by a factor of 440%, we are now paying university teachers an actual rate of 77% less than community college teachers were being paid 42 years ago.
Photographers either go out of business or cannot provide a quality product because they undervalue themselves, and in turn, the photography market is undervalued. What is the absolute minimum reasonable cost of being a photographer? How does this translate into a fair market price?
A photographer needs
Total = $20,359 minimum per year not counting travel or time!!!
bc -l
  500 + 80*12 + 1000/2 + 4000/3 + 1500 + 400 + 400 + (6700 + 3800 + 3900 + 2600 + 3900) / 3 + 300 + 5000 + 1000 + 1000 + 500
Assume 100 photos wanted / purchased 5 days every week, 32 weeks of the year (best case scenario for success during all possible photography seasons, leaving time for processing and office work) = 100 * 5 * 32 = 16,000
A successful slightly more than full-time photographer spends 10-20 hours a week actually doing photography, and at least 20-40 hours a week preparing, setting up, traveling, communicating, editing, processing, delivering, and publishing photos.
Sadly, the payment is usuallyu negotiated only on the basis of the 10-20 hours a week of "actual" photography. Let's add everything up over a 10-year period and see why photography is unsustainable.
Computing: laptop, desktop, tablet, cell phone. During ten years, four laptops are needed, three desktops, five tablets, and five cell phones: 4*1200 + 3+2000 + 5*900 + 5*900 + Cell phone service for 120 months * $80/month = $72,600. All of this is 100% needed. The business can't function without a marginally working
Back in a different millennium, I saw the statement that the smartest decision in the history of Unix was the choice of a single newline character. Windows decided to use the typewriter sequence of a carriage return and a linefeed to advance to a newline, despite the fact that computers don't have typewriter carriages that need to be returned.
Was this a mistake? How much did this mistake cost?
The human-generated data in the universe doubles every year. As of 2016, 1.2 zettabytes of data are produced annually. Much of this is textual, and many protocols, such as HTTP or MIME, constantly transfer even binary data either surrounded by text or encoded as text, and likeiwse use the carriage return + line feed sequence rather than only one character to represent moving to the beginning of a new line.
If as a conservative estimate, we assume textual data represent only 10% of data, including markup languages and transfer protocols used to transfer data, etc., then there are 130 billion gigabytes of textual data created each year.
If we assume that the data is transferred only once and used only once, then 260 billion GB of textual data are processed using electrical energy.
What is the cost of electrical storage and computer processing energy for the extra carriage return that doesn't represent anything for computers, but is left over from the days of typewriters?
The very rough average length of a line is about 50 characters. As we calculated recently, the true cost per GB for storage is $3.386. Thus, this extra character costs 1/50th of that, so about 7¢ per GB.
Therefore, the cost of the useless carriage return caused by typewriters and transferred into Windows-based computer systems and protocols such as HTTP, costs the world 260 billion times 7¢ this year. This is 18.2 billion dollars for storage alone, not even counting energy costs for processing an extra 2% more data.
Health insurance is a wonderful thing. Right? You pay only a few hundred dollars a month in order to insure that unexpected healthcare bills will be covered.
Or not...
Have you ever wondered how in the world insurance companies can make money? Do they really have altruistic motives, or is there also a deeper scheme lurking underneath, a clever plot to make even more moeny from the same amount of healthcare?
Let's analyze this question.
Imagine someone named Sarah. Her healthcare costs in the future are unknown, a random variable X dollars per year. Between many different possible scenarios, the value of X may range from $0 even up to $1,000,000 or even far more. Simplistically, according to a working model of statistics, this measure of uncertainty is quantified as the standard deviation S, if we in some sense "average" out the deviation between all these possible scenarios based on how likely each scenario is to actually happen in real life.
Now imagine there are many individuals, all across the nation, and assume that unexpected healthcare costs are distributed in a random fashion throughout all of these individuals. What is the average healthcare cost expected to be? Even more importantly, if an insurance company offers an insurance policy to everyone by charging a bit more than this average cost, how safe is it? What are the odds that the insurance company will lose money?
Let's define M as the amount of money the insurance company charges, and A as the average healthcare cost of everyone across the nation. Then the probability that the insurance company makes money is given symbolically as
P(Z > z)
where Z is a value from the normal distribution and the value of z is given mathematically by
z = (M - A)/S
If we want the insurance company to have a 98% chance of making a profit, then z needs to equal at least 2, even in an idealized case assuming the normal probability model.
Let's say that insurance is M = $500 and the average costs are A = $375, and the national "average" uncertainty between all the possible scenarios for annual medical costs is S = $5,000.
But then z is not even close to 2! In fact, z is only
(500-375)/5000 = 125/5000 = 25/1000 = 5/200 = 1/40 = 1/4 * 1/10 = 0.25 * .1 = 0.025
Terrible! This is (2/0.025) 80 times smaller than even a somewhat safe value of 2!! An insurance company would run way too much risk to offer insurance!
But what happens if you get more customers, quantity N? Ah ha! Then the formula changes!
z = (M - A)/(S/sqrt(N))
Obviously, due to inverse proportions and square roots, if your N is 100, then the denominator will be 10 times smaller, and therefore the z value will be 10 times larger than before!
And using the same logic, if the N is 6400, then the denominator will be 80 times smaller, and therefore the z value will be 80 times larger.
Presto! Once your insurance company has 6400 random customers, then it has a 98% chance of making a profit!
Now that we know how it works, that a large number of customers provide statistical safety for making a profit, let's analyze how much money is being made!!
On each customer, the insurance company is making an average profit of (Revenue - Cost) = (M-A), so the total profit is
P = N*(M-A)
Do you realize what this formula means?
It means that as wonderful as healthcare sounds, at the bottom line it is a way companies can make more money from the same amount of healthcare!
The actual cost of healthcare NEEDED doesn't change at all! But the amount of money SPENT on healthcare, due to insurance, increases VASTLY!
It makes no difference whether a nice name like "The Affordable Healthcare Act" or "Obamacare" or "Trumpcare" or anything is attached to it! The mathematical truth of what health insurance is remains the same!
Well, what difference does this make??? This is why MRIs cost $5,000 each! And then, to add insult to injury, they are often administered in pairs after the first results are "inconclusive" just so they can give you barium the next time and have you do it again for $5,000 more!! An MRI is simply a medical sensor, for crying out loud!! It is like paying $100 to stand on a scale! (I'd rather have a $10,000 new car, thank you very much!) Not to mention, having a doctor see you for one minute, and then write their name on a piece of paper, now costs $648! (I think I would rather have a brand new iPad for that much!!)
Just how big is this conspiracy? How much money is involved, first being sucked away from helpless people by big insurance companies, and then being greedily grabbed for by the medical industry by their ridiculous prices???
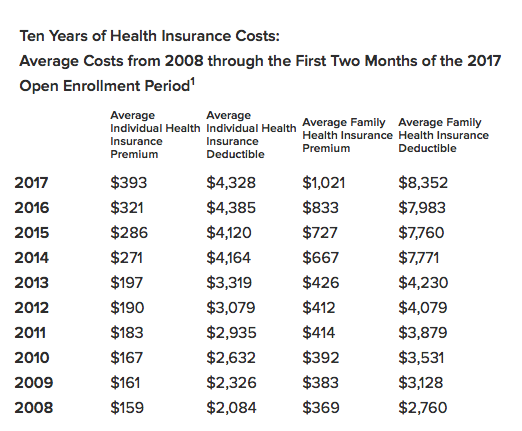
That's amazing! Average individual health insurance premiums have increased from $159 to $393, and average deductibles have increased from $2,084 to $4,328! In just ten years!
Think for a while and consider that the actual instrinic healthcare costs per person have not changed, not in terms of true needs of humans. I don't think we've changed into a differenct kind of living organism, have we? Even more, in terms of technological advancement, it should be cheaper to care for those needs today rather than ten years ago!
Yet the prices charged for everything have skyrocketed! It is all coming from these huge insurance profits!
Let's analyze it some more. Obviously, the insurance companies were making money back in 2008, even at $159 per individual.
This means that there is at least $393 - $159 equals $234 of profit now per person! Of course, the medical establishment is greedily grabbing as much of that profit as they can by needlessly increasing prices at all levels of the supply chain, but the problem itself arises from the money generated by insurance.
If 100 million people are insured, then 234*100 million is $23 billion dollars of profit!!
That is definitely not enough to satisfy the hunger for money!
So what is next in this brilliant scheme? The next brilliant idea is to have national health care that mandates for everyone to have insurance.
If the number of people insured increases to 350 million, then the profit rises by 250%! This is an additional $57 billion dollars of profit!
And remember, this profit is not the amount of healthcare needed, which never changed.
No, not at all, to answer our original question, this is not an altruistic scheme.
The extra money from the original $23 billion dollars of profit could have been used to pay for extra healthcare. But no.
More people are being forced to carry insurance simply to produce more profit, which in turn increases healthcare costs more and more, in an endless vicious cycle.
Every single penny of that money is a clever way for companies to make more money from the same amount of healthcare.
The love of money is the root of all evil.
Using iShares Gold Trust (ETF, NYSEARCA:IAU) and Silver Trust (ETF, NYSEARCA:SLV) historical data allows a business analytics technician to obtain an apples-to-apples consistent correlation between gold and silver prices (note: measured in shares, not ounces) of 85.4%. This allows one to create a fairly reliable linear regression model to set a baseline "actual" value for silver, based on the current value of gold. This model represents a savings of 0%, but due to fluctuations in the market there are often opportunities to purchase gold at a savings above 0%.
In fact, using the "Gold standard" as the independent variable, the silver savings from 2006 to 2017 looks like this:
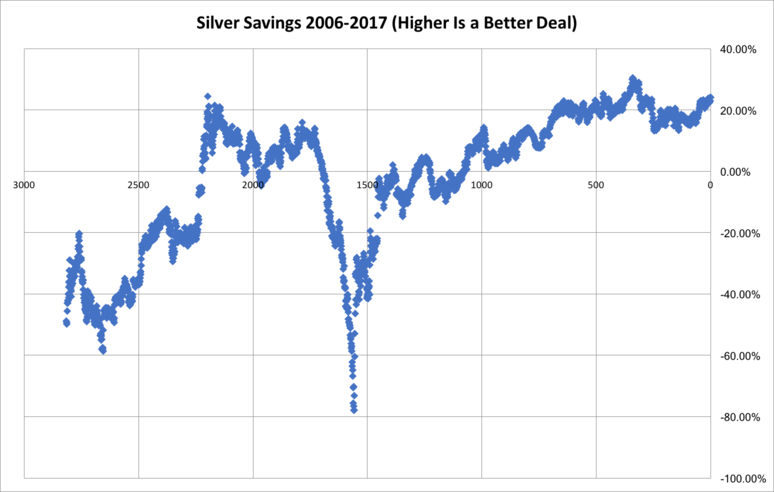
Assuming that gold and silver both have a true and unchanging intrinsic value, when the savings on silver is positive it might be better to exchange gold for silver, and vice versa. (Note: if one looks at the data further back through the 1700s, one will notice that for many years gold and silver had an unchanging value with respect to one another due to their use in currency. This currency constraint valued silver much higher when compared to gold than is generally true today.)
Business insurance is usually a percentage of your assets, but you pay this amount every year, resulting in a much higher actual cost.
For example, if I pay insurance at 3% on all of my photography equipment, as follows, what is my actual effective insurance rate, and how much should I charge customers in order to break even?
The total is $100K, so I'll be paying $3000 of business insurance annually. If my average equipment lifetime is seven years, the actual percentage of business insurance I am paying is 21%! This doesn't even include the original sales tax.
In the very best case scenario, a highly successful photographer could be doing 40 weeks of work per year at five days per week. I imagine the work orders for a vast majority of photographers are much less consistent, with many extended periods when business slows to a crawl.
Even in this best case of 200 working days, to cover your business insurance alone, as a professional photographer you must generate $15 of revenue daily from your customers specifically to cover your business insurance, independently of all your other expenses. Otherwise, you are running a non-profit organization, not a business.
Recently, during a few back-to-back weddings (photo and video), I noticed my digital files weighed in at around 310 GB per wedding. Should I be adding a per-GB surcharge to my services?
The answer is a resounding yes. Let's analyze it.
My photos are stored on a high performance RAID unit replaced every four years, storing an average of 24 TB (lifecycle linear interpolation of 0-48 GB capacity). Including business insurance and utilities, its cost is $4733. What is the $/GB per year cost so far? 4733/(24*1000)/4.
Also, I use HGST He10 10 TB drives. Including business insurance over their lifetime, they are $1091 each. Four of them are needed in each RAID set to achieve the necessary high performance RAID 10 array to meet my active editing needs. I use a 75% fill policy for data security and safety. The result is 16 TB, also on a four-year replacement cycle. The marginal added cost is (1091*4)/(16*1000)/4.
For local and remote backup, I use 8 TB drives at $250 apiece, subject to the same 75% fill policy (6 TB). These are replaced every two years. Two drives are needed (local and remote), and, including business insurance and taxes, the cost is $622 to backup 6 TB. This cost is 622/(6*1000)/2.
All in all, we have 4733/(24*1000)/4 + (1091*4)/(16*1000)/4 + 622/(6*1000)/2, which is $.16932292 per GB per year.
Now obviously, I don't throw my pictures or videos away. I'll need to store these pictures and videos for the rest of my life, and hopefully someone will keep storing them forever. The cost will skyrocket as a result.
On the other hand, storage technology is slowly advancing. In an ideal case, the cost of storing these files ten years later might be half as much as it is now, and, ten years later, the same thing might happen again, etc.
This means that we need to calculate the cost of storing the files for the next ten years, and then add that same cost once more (theory of geometric series: if you go half as far each time, the limit will be twice as far as your initial amount).
So let's multiply the annual cost per GB by ten, and then double it, to come up with an appropriate and fair per-GB surcharge for my photography and videography clients.
10*.16932292*2 = $3.38645840
Clearly, I should be adding a surcharge of $3.39 per GB in order to provide for my own basic storage costs. This means I will ultimately face a loss for those weddings, because I did not include 310*3.38645840 = $1049.80 for my true photography and video storage cost.
Do you see how urgent this is? How many photographers price themselves out of business because they forgot to benchmark all the true costs of their business?